1. pprof是什么 pprof is a tool for visualization and analysis of profiling data.
Profile Profile 是一个调用栈踪迹的集合,显示导致特定事件(如内存分配)的实例的调用栈序列。包可以创建并维护它们自己的profile;它一般用于跟踪必须被显式关闭的资源,例如文件或网络连接。
1
2
3
4
5
6
goroutine - stack traces of all current goroutines heap - a sampling of memory allocations of live objects allocs - a sampling of all past memory allocations threadcreate - stack traces that led to the creation of new OS threads block - stack traces that led to blocking on synchronization primitives mutex - stack traces of holders of contended mutexes
特点:将性能分析的粒度细化到具体的函数
2. 如何使用 (1). http接口版本,在main程序中加入如下代码:
1
2
3
4
5
6
7
8
9
package mainimport _ "net/http/pprof" func main () go func () http.ListenAndServe("0.0.0.0:6060" , nil ) }() }
(2). 在代码中手动配置
1
2
3
4
5
6
7
8
9
10
11
12
13
14
15
package mainimport ( "os" "runtime" "runtime/pprof" ) func main () f, _ := os.Create("/tmp/profile.pb.gz" ) defer f.Close() runtime.GC() pprof.WriteHeapProfile(f) }
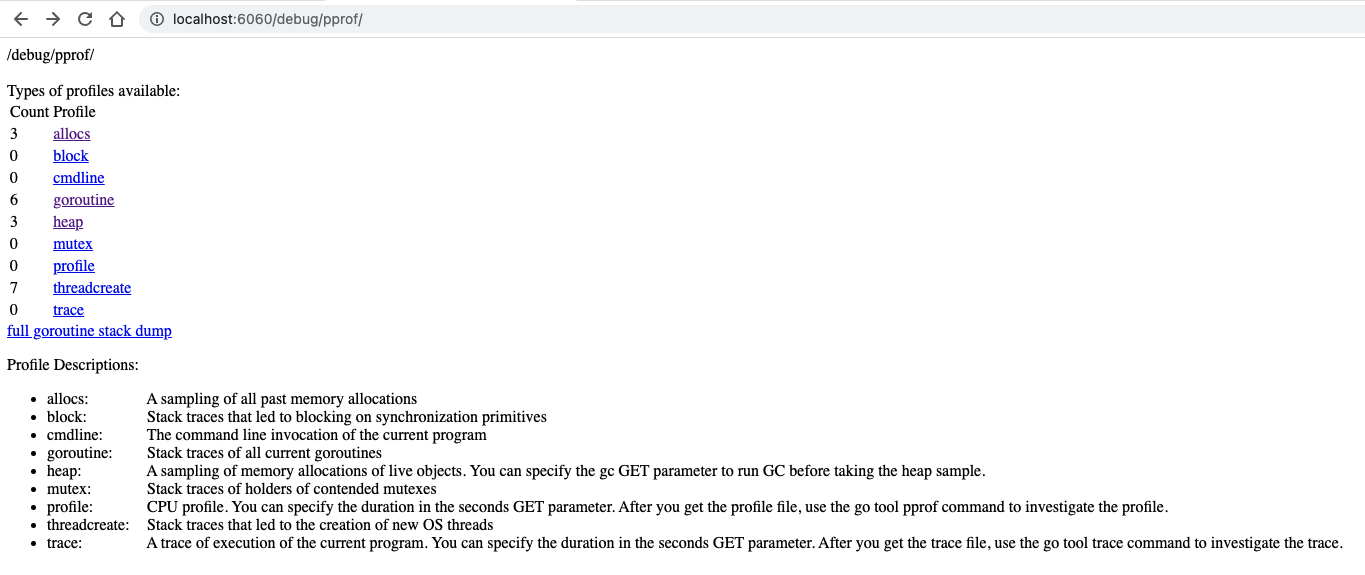
查看 在浏览器输入http://localhost:6060/debug/pprof ,可实时查看具体使用数据
源代码:
1
2
3
4
5
6
7
8
9
10
11
12
13
14
15
16
17
18
19
20
21
22
23
24
25
26
27
28
29
30
31
32
33
34
35
36
37
38
39
40
41
42
43
44
45
46
47
48
49
50
51
52
53
54
55
56
57
58
package mainimport ( "net/http" _ "net/http/pprof" "strconv" "github.com/labstack/echo/v4" ) func main () go func () http.ListenAndServe("0.0.0.0:6060" , nil ) }() e := echo.New() e.GET("/fib" , func (c echo.Context) error ns := c.QueryParam("n" ) n, _ := strconv.ParseInt(ns, 10 , 64 ) res := fib(n) slowfib(n) return c.JSON(http.StatusOK, res) }) go allocateMemory() e.Logger.Fatal(e.Start(":1323" )) } func allocateMemory () _ = make ([]int64 , 1000 *1000 ) allocateMemory2() } func allocateMemory2 () arr := make ([]int64 , 1000 *1000 ) ch := make (chan int64 ) ch <- arr[0 ] } func slowfib (n int64 ) int64 if n <= 1 { return 0 } return slowfib(n-2 ) + slowfib(n-1 ) } func fib (n int64 ) int64 if n == 0 { return 0 } var a, b, i int64 = 0 , 1 , 1 for i < n { a, b = b, a+b i++ } return b }
查看 内存分配四种类型:
使用:
1
2
3
4
5
6
7
8
9
10
11
12
13
14
15
16
17
18
19
20
21
22
23
go tool -alloc_space pprof http://localhost:6060/debug/pprof/heap Type: alloc_space Time: Feb 25, 2022 at 2:12pm (CST) Entering interactive mode (type "help" for commands, "o" for options) (pprof) top Showing nodes accounting for 19734.18kB, 100% of 19734.18kB total Showing top 10 nodes out of 25 flat flat% sum% cum cum% 7816kB 39.61% 39.61% 15632kB 79.21% main.allocateMemory 7816kB 39.61% 79.21% 7816kB 39.61% main.allocateMemory2 (inline) 1537.69kB 7.79% 87.00% 1537.69kB 7.79% runtime.allocm 1024.41kB 5.19% 92.20% 1024.41kB 5.19% runtime.malg 516.01kB 2.61% 94.81% 516.01kB 2.61% unicode.init 512.05kB 2.59% 97.41% 1028.06kB 5.21% runtime.main 512.02kB 2.59% 100% 512.02kB 2.59% net/http.(*Server).trackListener 0 0% 100% 512.02kB 2.59% main.main.func1 0 0% 100% 512.02kB 2.59% net/http.(*Server).ListenAndServe 0 0% 100% 512.02kB 2.59% net/http.(*Server).Serve
使用 list + 函数名可查看函数占用细节
1
2
3
4
5
6
7
8
9
10
11
12
13
14
15
16
17
18
19
20
21
22
23
24
25
26
27
28
29
30
31
32
(pprof) list main.allocateMemory Total: 18.27MB ROUTINE ======================== main.allocateMemory in /Users/yy/code/tmp/pprof/go_pprof.go 7.63MB 15.27MB (flat, cum) 83.57% of Total . . 26: . . 27:} . . 28: . . 29:func allocateMemory . . 30: 7.63MB 7.63MB 31: _ = make([]int64, 1000*1000) . . 32: // ch := make(chan int64) . . 33: // ch <- arr[0] . 7.63MB 34: allocateMemory2() . . 35:} . . 36: . . 37:func allocateMemory2 . . 38: arr := make([]int64, 1000*1000) . . 39: ch := make(chan int64) ROUTINE ======================== main.allocateMemory2 in /Users/yy/code/tmp/pprof/go_pprof.go 7.63MB 7.63MB (flat, cum) 41.78% of Total . . 33: // ch <- arr[0] . . 34: allocateMemory2() . . 35:} . . 36: . . 37:func allocateMemory2 7.63MB 7.63MB 38: arr := make([]int64, 1000*1000) . . 39: ch := make(chan int64) . . 40: ch <- arr[0] . . 41:} . . 42: . . 43:func slowfib(n int64) int64 {
查看cpu 参考 go blog
1
2
3
4
5
6
7
go tool pprof http://localhost:6060/debug/pprof/profile?seconds=10 Type: cpu Time: Jan 6, 2022 at 4:48pm (CST) Duration: 30.11s, Total samples = 15s (49.82%) Entering interactive mode (type "help" for commands, "o" for options) (pprof)
使用top查看
1
2
3
4
5
6
7
8
9
10
11
12
13
14
15
(pprof) top Showing nodes accounting for 2.59s, 99.62% of 2.60s total Dropped 9 nodes (cum <= 0.01s) flat flat% sum% cum cum% 2.59s 99.62% 99.62% 2.59s 99.62% main.slowfib 0 0% 99.62% 2.59s 99.62% github.com/labstack/echo /v4.(*Echo).ServeHTTP 0 0% 99.62% 2.59s 99.62% github.com/labstack/echo /v4.(*Echo).add.func1 0 0% 99.62% 2.59s 99.62% main.main.func2 0 0% 99.62% 2.59s 99.62% net/http.(*conn).serve 0 0% 99.62% 2.59s 99.62% net/http.serverHandler.ServeHTTP
查看占用细节
1
2
3
4
5
6
7
8
9
10
11
12
13
14
15
16
17
18
19
(pprof) list main.slowfib Total: 1.59s ROUTINE ======================== main.slowfib in /Users/yy/code/tmp/pprof/go_pprof.go 1.59s 2.57s (flat, cum) 161.64% of Total . . 38: arr := make([]int64, 1000*1000) . . 39: ch := make(chan int64) . . 40: ch <- arr[0] . . 41:} . . 42: 650ms 650ms 43:func slowfib(n int64) int64 { 20ms 20ms 44: if n <= 1 { 310ms 310ms 45: return 0 . . 46: } 610ms 1.59s 47: return slowfib(n-2) + slowfib(n-1) . . 48:} . . 49: . . 50:func fib(n int64) int64 { . . 51: if n == 0 { . . 52: return 0
3. 可视化 需要安装 graphviz ~/pprof/pprof.samples.cpu.001.pb.gz的文件,使用如下命令会打开浏览器并展示可视化的数据:
1
2
3
go tool pprof --http :8080 ~/pprof/pprof.samples.cpu.001.pb.gz go tool pprof --http :8080 http://localhost:6060/debug/pprof/heap
即可在web中查看。文档
4. 应用与实践 debug内存泄漏 原理就是前后两个时间点的内存占用快照做diff,找到导致内存增加的函数
1 curl -s http:// localhost:6060 /debug/ pprof/heap > base.heap
待内存增加后,再保存一份快照
1 curl -s http:// localhost:6060 /debug/ pprof/heap > current.heap
然后可进行对比:
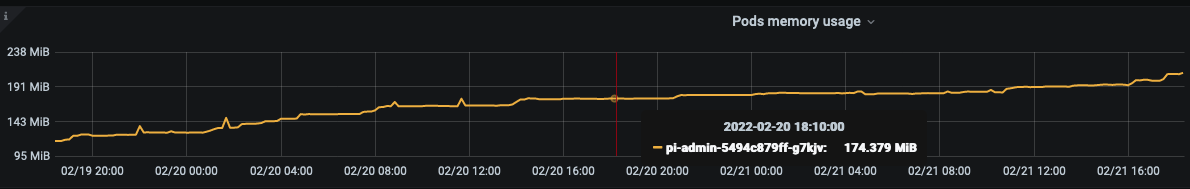
实例 线上一个服务的内存占用情况
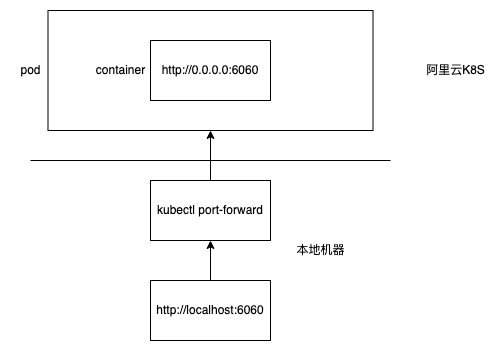
获取数据: 1 kubectl port-forward instance_id 6060 :6060 -n test