1 背景
以前的pprof介绍与实践仅介绍了cpu和内存相关的功能,这里介绍查看io时间的功能
在后端服务中,大概率会出现调用多个涉及io的函数,如下所示:
1
2
3
4
5
6
7
| func handler() {
mongdbOperation()
redisOperation()
rpcOperation()
otherCpuOperation()
...
}
|
随着业务增长和时间推移,你发现这个handler函数有点慢了,得优化下,你想知道里面具体每个函数的执行时间。用pprof的cpu profile仅能查看cpu占用时间,无法查看io时间。当然也可以手动添加代码来查看函数执行时间,如下所示:
1
2
3
4
5
6
7
8
9
10
11
12
13
| func handler() {
t1 := time.Now()
mongdbOperation()
fmt.Println("mongdbOperation elapsed: ", time.Since(t1))
t2 := time.Now()
redisOperation()
fmt.Println("redisOperation elapsed: ", time.Since(t2))
t3 := time.Now()
rpcOperation()
fmt.Println("grpcOperation elapsed: ", time.Since(t3))
otherCpuOperation()
...
}
|
但是这样写的话,代码有侵入性,很冗余,很麻烦,一句话,很ugly。这时使用go trace工具就很好了。可以不用添加额外代码,就能达到目的。
使用以下简化的 server.go 代码演示使用,简化的代码仅有一个io函数:mongoOpt
1
2
3
4
5
6
7
8
9
10
11
12
13
14
15
16
17
18
19
20
21
22
23
24
25
26
27
28
29
30
31
32
33
34
35
36
37
38
39
40
41
42
43
44
45
46
47
48
49
50
51
52
53
54
55
56
57
58
59
60
| package main
import (
"context"
"log"
"net/http"
_ "net/http/pprof"
"os"
"time"
"github.com/labstack/echo/v4"
"github.com/labstack/echo/v4/middleware"
"go.mongodb.org/mongo-driver/bson"
"go.mongodb.org/mongo-driver/mongo"
"go.mongodb.org/mongo-driver/mongo/options"
"go.mongodb.org/mongo-driver/mongo/readpref"
)
var mongoClient *mongo.Client
func main() {
go func() {
http.ListenAndServe("0.0.0.0:6060", nil)
}()
mongoClient = initMongoDB(os.Getenv("uri"))
e := echo.New()
e.Use(middleware.Logger())
e.GET("/hello", func(c echo.Context) error {
mongoOpt(c.Request().Context())
return c.NoContent(http.StatusOK)
})
e.Logger.Fatal(e.Start(":1323"))
}
func initMongoDB(uri string) *mongo.Client {
ctx, cancel := context.WithTimeout(context.Background(), 10*time.Second)
defer cancel()
opt := options.Client()
opt.SetMaxConnIdleTime(time.Minute)
opt.SetMaxPoolSize(20)
client, err := mongo.Connect(ctx, opt.ApplyURI(uri))
if err != nil {
log.Fatalf("failed to create mongo client err: %v", err)
}
ctx, cancel = context.WithTimeout(context.Background(), 5*time.Second)
defer cancel()
if err := client.Ping(ctx, readpref.Primary()); err != nil {
log.Fatalf("failed to ping mongo err: %v", err)
}
return client
}
func mongoOpt(ctx context.Context) error {
coll := mongoClient.Database("pi").Collection("device")
coll.FindOne(ctx, bson.M{})
return nil
}
|
2 使用
启动这个server,访问 http://localhost:1323/hello 后,会进行一个 mongodb 的查询操作,我们的目的就是要查看到 mongodbOpt 的io时间。
命令行执行 wget -O trace.out http://localhost:6060/debug/pprof/trace\?seconds\=10 会把10s内的trace情况保存在 trace.out 文件中
此时我们访问下 http://localhost:1323/hello 触发 mongoOpt 调用。
10s后数据已保存完毕,使用 go tool trace trace.out 命令查看 trace 细节
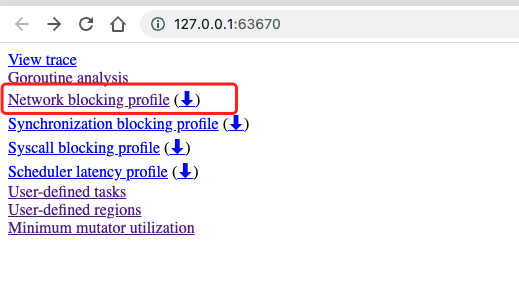
点击图中的 Network blocking profile 后可看到 mongoOpt 的io时间
